Debugging Servlets using Netbeans
It is possible to execute and debug servlets from within NetBeans. This is
done by using the internal Tomcat server that comes with NetBeans.
When you execute a servlet in NetBeans, it will try to start the internal
Tomcat. Since Tomcat is running inside of NetBeans, you will be able to set
breakpoints in the code and stop execution of the servlet. You will still
use the browser to interact with the servlet, but control will return to
NetBeans when a breakpoint is encountered.
-
Create a servlet in the Source Packages of the Web Project.
-
In the
index.jsp file of the Web Project, add a link to your servlet.
-
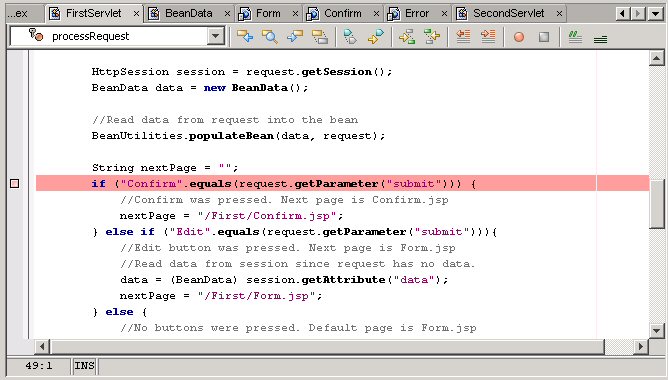
Place a breakpoint on a line inside of doGet in the servlet by clicking in the left margin of the code window.

-
From the Run menu select Debug Main Project,
-
NetBeans will start the internal Tomcat and will display the
index.jsp in the
browser.
-
Follow the link from the
index.jsp page to your servlet.
-
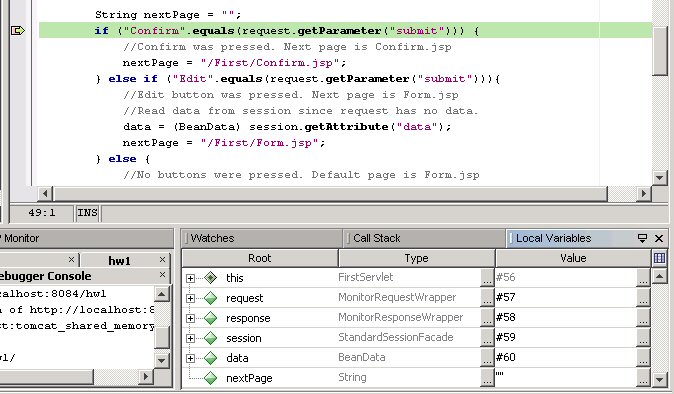
Control should pass to the breakpoint in NetBeans.
-
Examine the current state of variables in the
Local Variables tab.

-
Examine the methods that are currently in progress in the
Call Stack tab.

-
It is now possible to execute statements individually. There are many options
for controlling program execution.
- Stop - Stop debugging
- Pause - Pause Debugging
- Continue - Start executing again. Stop at next breakpoint.
- Step Over - If the current statement has a call to a subroutine,
then execute the entire subroutine.
- Step Into - If the current statement has a call to a subroutine,
then move into the subroutine.
- Step Out - If the current statement is in a subroutine, then execute
the remaining statements in the subroutine and return to the caller.
- Run to Cursor - Execute all the statements from the current program
location to the line of code that contains the cursor.
-
There are toolbar buttons for each of these options.


