logo Applying Data Science to perform Real Estate Analysis in South Florida
 
banner
Introduction

Asking yourself if you can apply Computer Science tools and techniques to better understand a local real estate market and to make better investment decisions?

That is precisely what I did together with a couple of friends, and we are happy to share our conclusions with you.

Our team is formed by Adrian Hernandez, Miguel Barquet and Roger Jimenez and in the last 3 months we embarked on this adventure to try to Apply Data Science to perform Real Estate Analysis in South Florida.

This project is part of class CAP 5768 Introduction to Data Science imparted at Florida International University in the Fall of 2019 by professor Giri Narasimhan.

back to top


Goals

Our goal was to gain a greater understanding of the local real estate market, focusing on Miami-Dade County and Broward County. We wanted to discover what are the driving factors that have a higher impact on prices. Also, to find out if there is any seasonality on the prices and if so, what are the best and worst time to buy and sell real estate during the year. Finally, we wanted to identify what areas and neighborhoods are best to invest and what makes those areas such a good bet.

back to top


Method

First and foremost, you must start with the fundamentals…Like any other market, Real Estate is shaped by the opposing forces of Offer and Demand. It is critical to understand how these forces work and what are the key indicators that can show us where the market is going.

Here are some of the factors that impact the market:

  • Interest Rates
  • Unemployment / Employment
  • Average rent rates in the area
  • Vacancy rate
  • Inventory available
  • Loan to value ratios on existing mortgages

It is also important to understand that each property is unique therefore it is important to look at the particularities of prospective units:

  • Location
  • Condition
  • Existing Financing
  • Buyer’s financing options
  • Seller motivation / needs
  • Real Time Market value (after repairs)

We soon found out that there is a lot of data readily available from different sources which is no doubt a very good thing for analysts but also brings about a big challenge that is to be able to sort through all that data and select the indicators that better represent the market forces. The Curse of Dimensionality is real and it is painful!!!

We decided to use data from sources that are reliable and easy to use. For example:

  • Zillow.com
  • Census.gov
  • Gun Violence Archive
  • Miami-Dade County Open Data Hub
  • The Florida Department of Education
  • Yahoo Finance
  • Federal Bank of Saint Louis

Below a class diagram showing some of the independent datasets we used and the information they contain. The sizes of the datasets vary from just a few hundred entries to millions of entries in some cases.

Datasets Class Diagram

In order to get the most out of all this data, we followed a consistent approach. First, we explored each dataset independently to get familiar with the information it contains, the way it is represented and to find trends in the graphs and other visualizations. Second, we combined several datasets together and did a more advanced analysis with emphasis on finding correlations between the different indicators and making predictions.

One of the many advantages of data science is that it allows us to easily visualize data in ways that are easier to interpret by human beings. Using multiple Python libraries and even other tools like Tableau we converted a bunch of numbers into trend graphs, bar charts, maps with geographical locations, heatmaps, scatter plots, violin plots, histograms and much more.

back to top


Macroeconomic Analysis

As part of the analysis, we looked at macro-economic data as well as data grouped by zip codes, census tract and even individual properties. We began by conducting a high level analysis which would subsequently inform our lower level analysis.

We began by conducting a high level analysis which would subsequently inform our lower level analysis. We used high level analyses to identify things like:

  • On which markets should we focus our analysis, and how should we segment these markets? After all, the profile of one who purchases a $150,000 house is not the same as one who purchases a $600,000 house.
  • Are there seasonal patterns that exist independently of low-level factors that influence price, such as crime?
  • Can we say with some certainty that there is a best time to buy and sell a home?

To determine how markets should be segmented, we looked at how supply and demand was distributed across a range of prices.

We utilized time series analysis tools to identify seasonal patterns that exist and compared those patterns across varied data sets to rule out region-dependent confounds.

To answer the final question, we examined high level seasonal patterns using predictive modeling techniques including Seasonal ARIMA (Autoregressive Integrated Moving Average) to ascertain when is generally the best time to buy and sell a home in South Florida.


back to top


Prediction Model

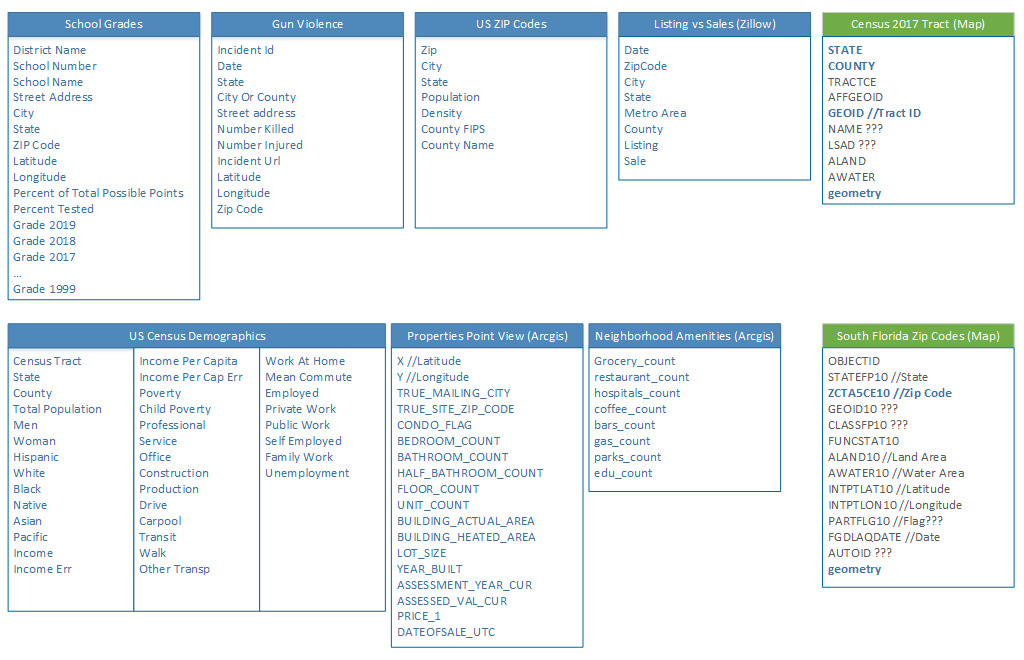
To perform a micro analysis of the real state market, we draw data from different sources. We used the property appraiser data from Miami-Dade County Open Data Hub (https://gis-mdc.opendata.arcgis.com/datasets/property-point-view), a dataset with gun violence incidents reported between 2015 and 2018  (https://www.kaggle.com/ericking310/us-gun-violence) and a dataset of neighborhood facilities around each property that we generated using ArcGIS (https://developers.arcgis.com/python/) geocoding services. 

We focused on the properties sold in 2019. After preprocessing the data, we ended up with a dataset of 4595 properties. For each property, we calculated a gun violence score accounting for the gun violence incidents   that occurred within 1 mile of the property. Also, we leveraged ArcGIS geocoding APIs to find the number of groceries, coffee shops, educational centers among other facilities in the neighborhood of every property (within 1 mile). Then we enhanced the properties dataset with the gun violence score and several neighborhood facilities columns and used that for our analysis. 

We split the dataset into two sets, 80% for training and the remaining for testing. Then we first implemented a linear regression model, fit it to our data and validated it on the testing set. The R^2 score of the model was 70% and the mean absolute error was 34114, meaning that the predicted prices deviate from the actual prices in our test set by 34114 dollars on average. 

In an effort to improve our predictions, we also implemented a Gradient Boosting Regressor, which yielded slightly better perditions with 75% R^2 score and 29822 mean absolute error. By inspecting the feature importances, we observed that the building size in square foot had the highest weight, followed by the building’s coordinates and the gun violence score, reinforcing the intuition that property size, location and safety are key features that drive property prices.

It was interesting, although not surprising, to observe the positive impact of city amenities and good schools in the prices while several crimes and bad schools in the area highly correlated with much lower prices.

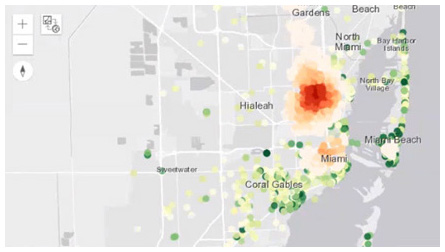
To do such analysis on our own we assigned a weight to different types of crimes from small incidents involving firearms, injuries, and ultimately kills caused by gun violence.

The screenshot on the right shows in red the properties that are affected the most by gun violence.

back to top


Classification Model

We also implemented a classification model, to label properties as favorite or not favorite according to potential buyers preferences. For this we had to create our own labels data, and followed a filter based approach where we assigned weights to each feature (negative values to penalize undesirable features , gun violence or price for example and positive values to reward others like the size of the living area). Using this we calculated a desirability score for every property in the dataset, the higher the score the more desirable the property. Then we trained a logistic regression model and tested on the validation test achieving an accuracy of 78%.

back to top


Conclusions

Overall, the results were very inspiring and staring at all the possible studies that can be conducted using Data Science tools and techniques left us with a deep sense of awe and respect for the discipline and its use in real life situations.

It is important to note however that data science is not a crystal ball or magic mirror, instead it should be used to complement other traditional methods of evaluating an investment. It is always recommended to do your due diligence and carefully inspect any property you are considering purchasing, as well as carefully analyzing the financial and legal aspects of the deal.

Moreover, smart investors can make money in both high and low markets; all year round. The secret is to apply the fundamental concepts to understand how the market forces are shifting and then adapt your strategy accordingly.

Data Science can be a great tool in the hands of an investor who knows how to best use it.

CAP 5768 Introduction to Data Science

back to top


Headlines

Introduction

Goals

Method

Macroeconomic Analysis

Prediction Model

Classification Model

Conclusions


CAP 5768 Introduction to Data Science | FIU 2019